Entry Point spans of service in Key Operations Table
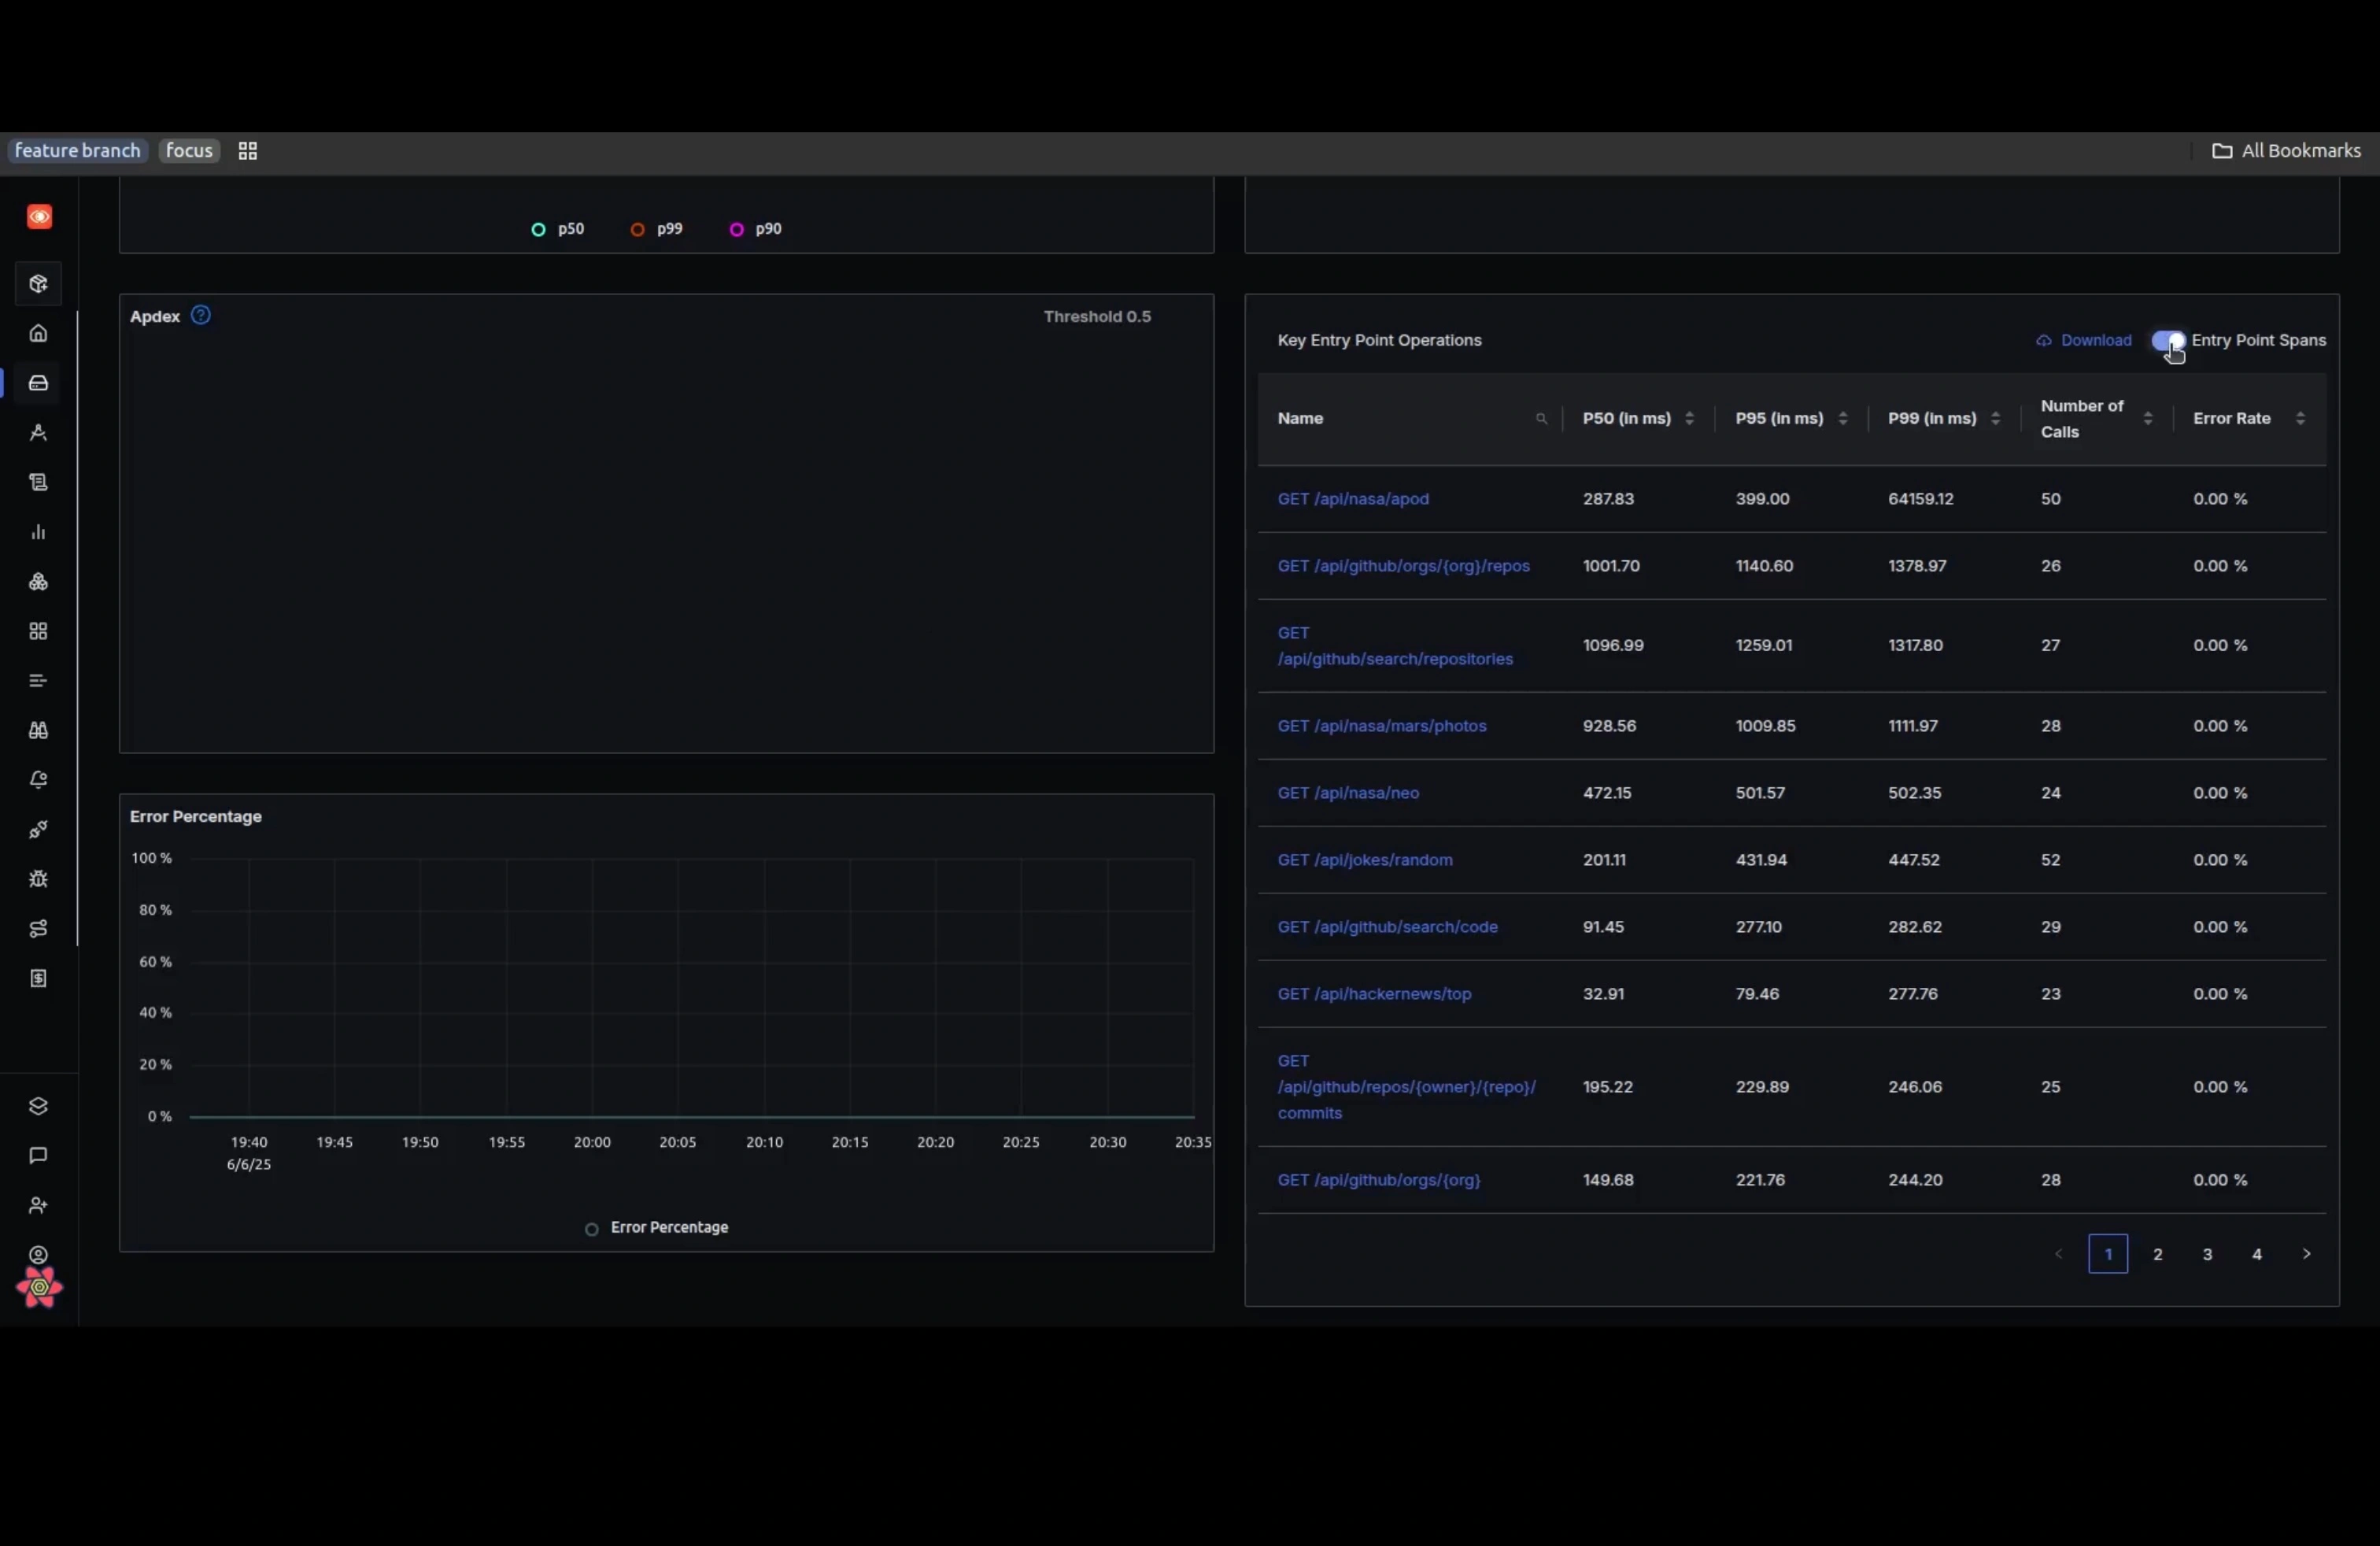
The Key Operations table surfaces the most important spans in a service, letting you quickly spot which calls contribute most to latency or errors.
For every span it lists P50, P95, and P99 latencies, the call count, and error rate, so you can compare performance at a glance. Because a busy service can generate thousands of spans, we added a “Entry Point Spans” toggle that filters the list down to spans where the serviceName changes, i.e., the first span when a request enters this service from any upstream service.
Switching on the toggle hides the internal, downstream spans and shows only these entry-point spans, giving you a concise, high-level view of how external traffic is behaving without losing sight of latency outliers or error hotspots.